System Reliability
We monitor every layer of our infrastructure in real time — from individual pods to API endpoints — so transit agencies never have to worry.
0.00%
Uptime SLA
0+ Weeks
Continuous pod uptime
0%
Endpoint success rate
0
Unplanned restarts
Monitoring Stack
Five tools. Every layer covered.
Real screenshots from our live monitoring dashboards — this is what our infrastructure looks like right now.
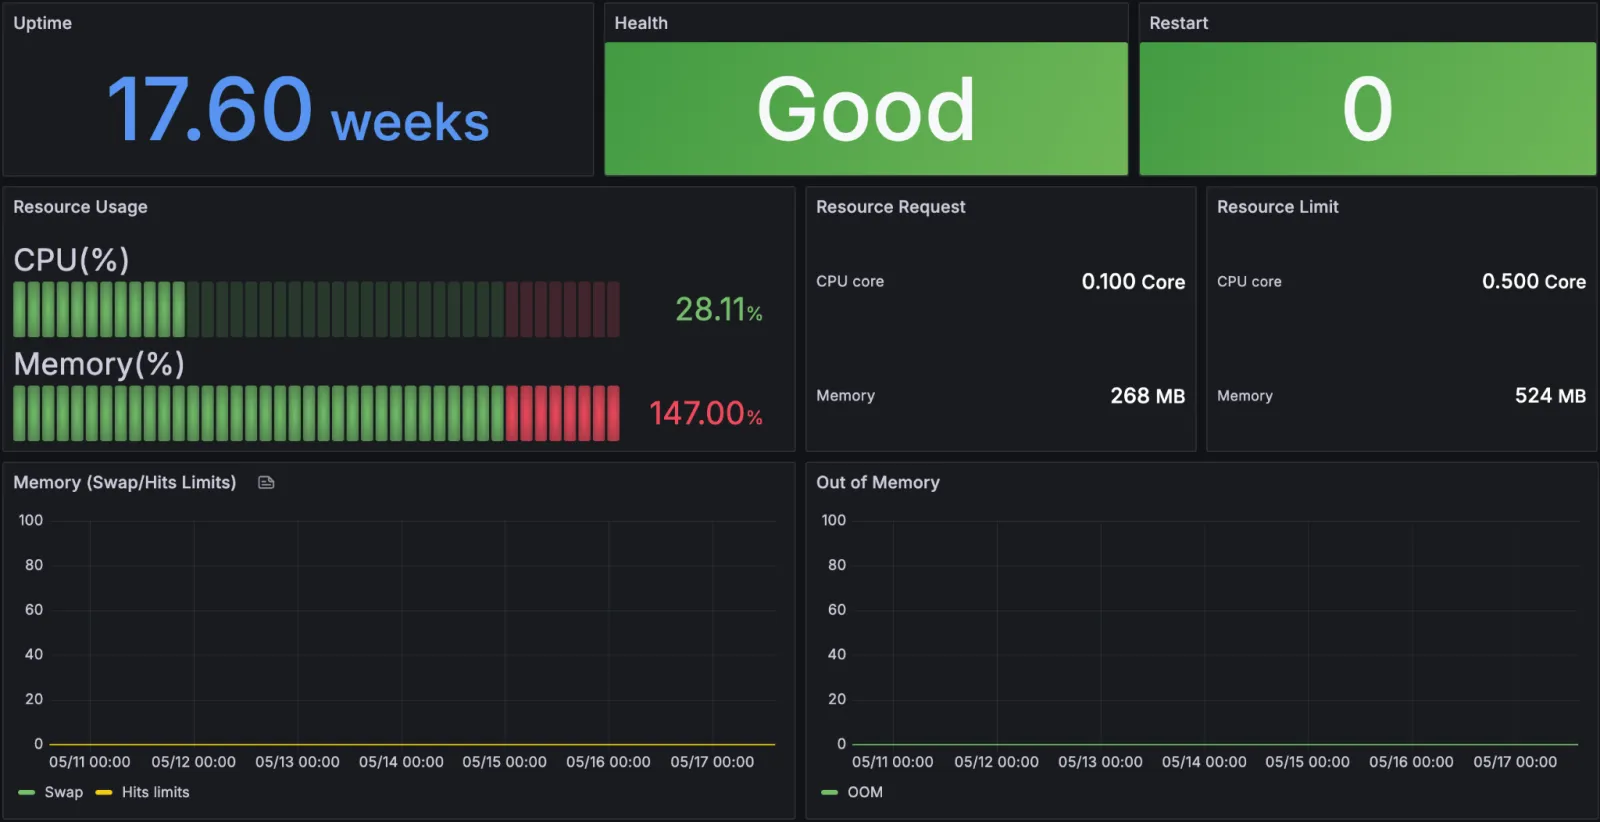
Tracks individual pod uptime, health status, and restart count across all production services.
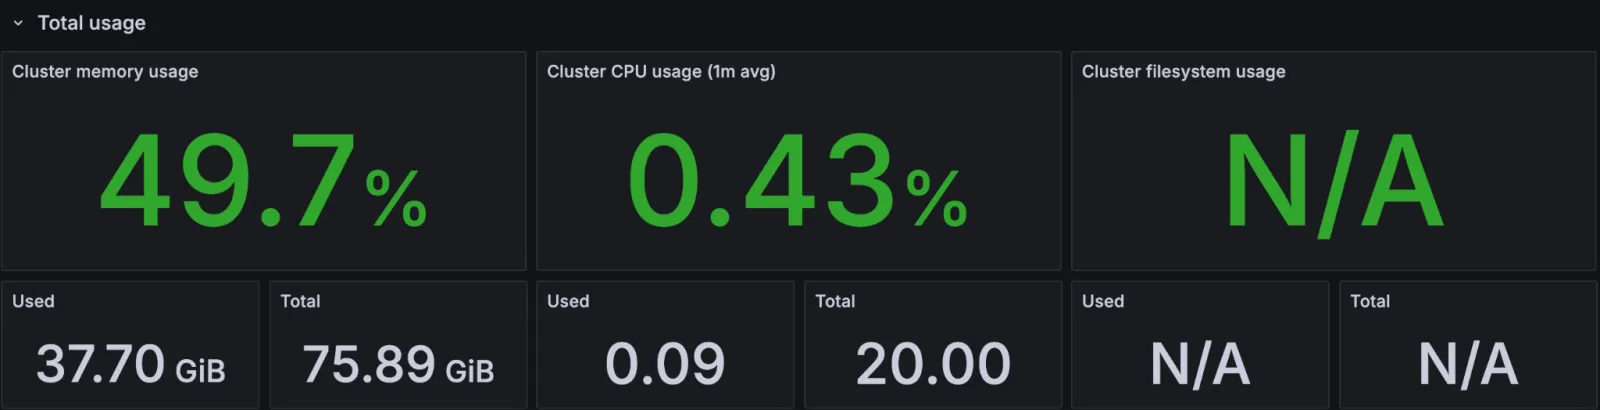
Monitors cluster-wide CPU and memory usage to detect resource pressure before it affects service.
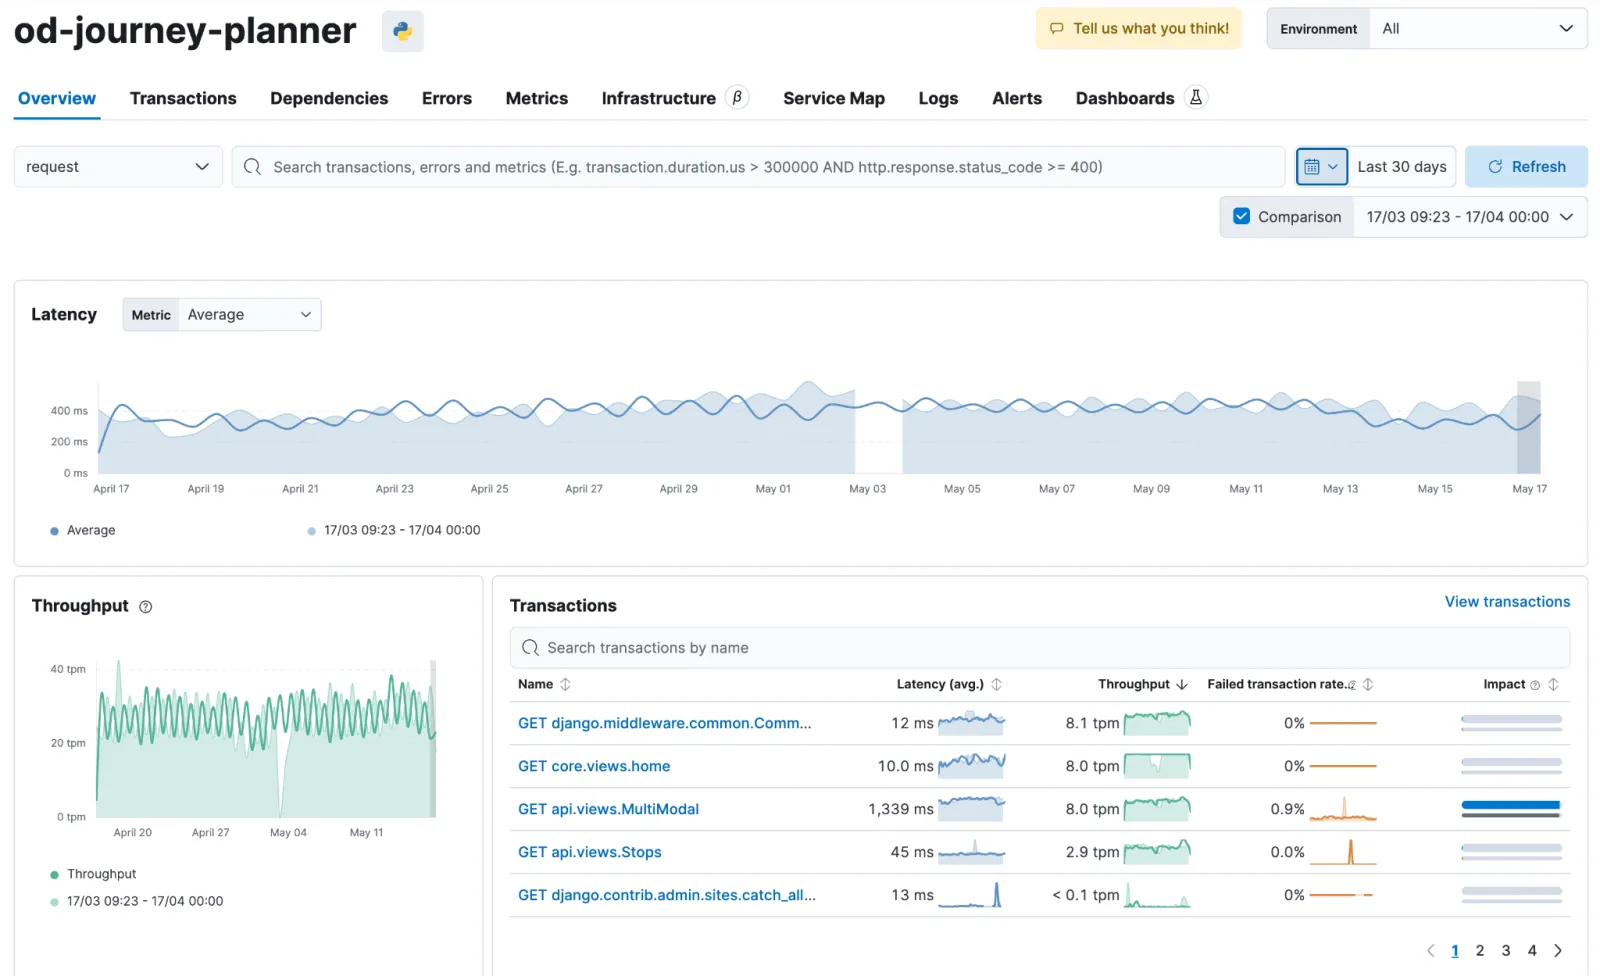
Measures API response latency and throughput for every endpoint, with full request tracing.
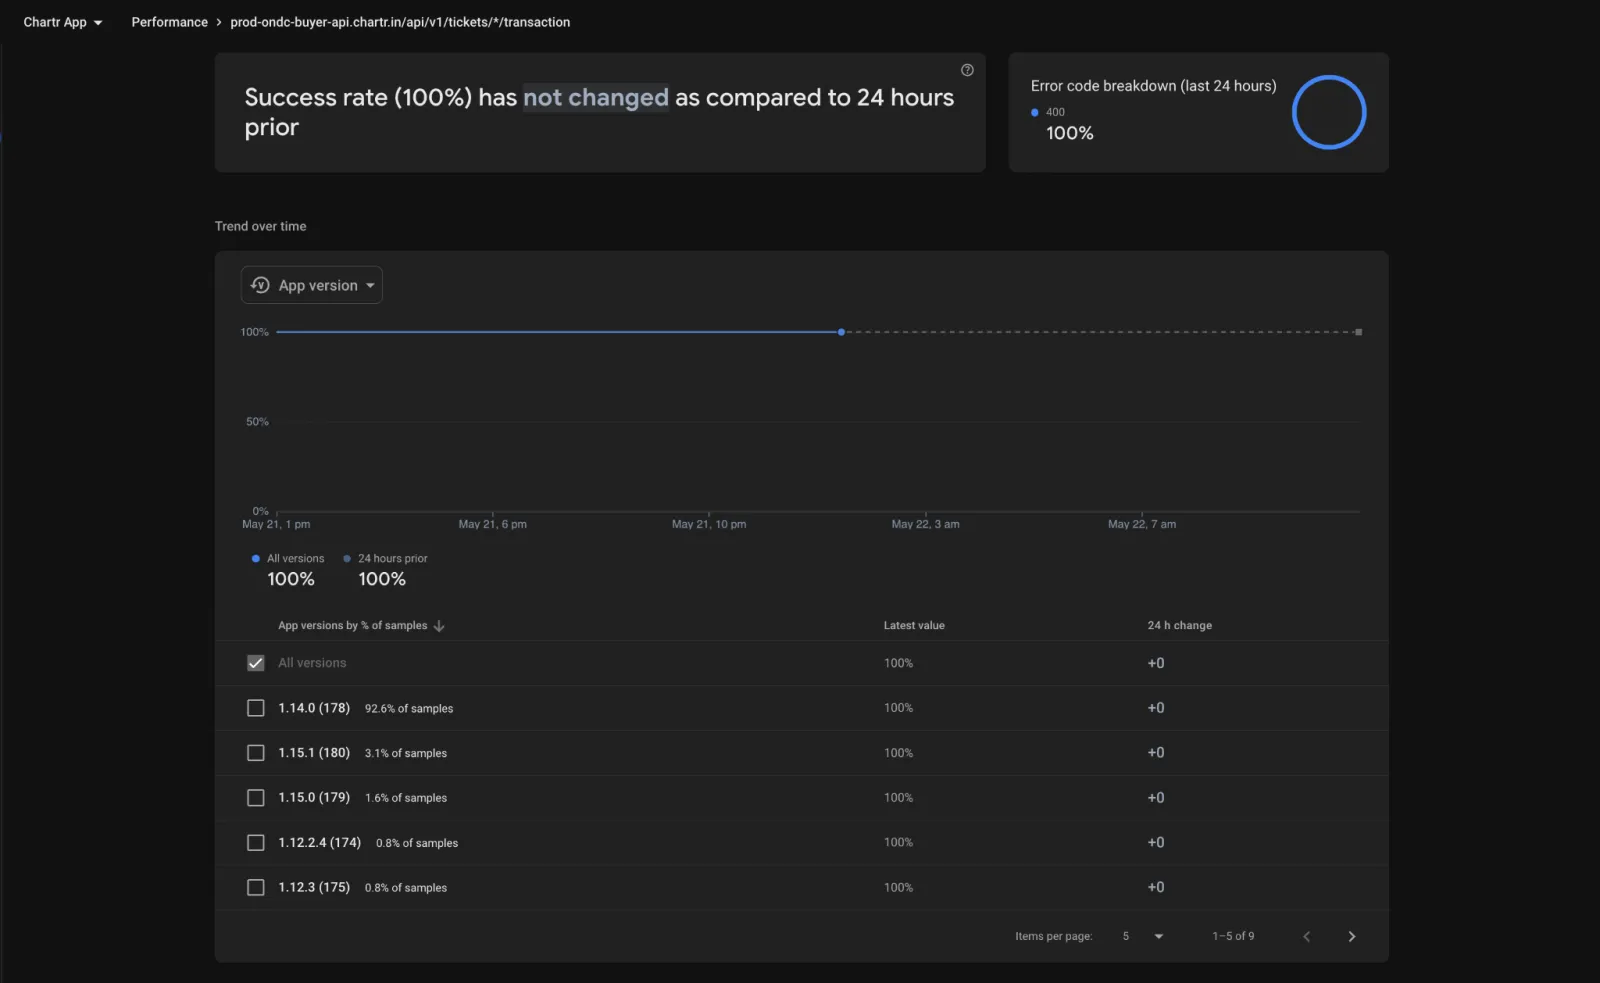
Tracks success rate for all Firebase endpoints serving the Chartr mobile and rider-facing apps.
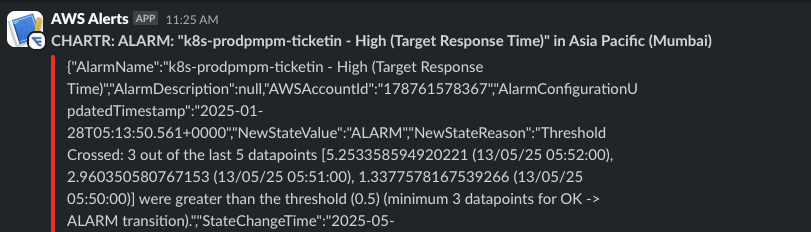
AWS CloudWatch watches Kubernetes in production and fires instant Slack alerts for any anomaly.
Philosophy
How it works
01
Multi-layer observability
Every layer is watched — from individual Kubernetes pods to database connections, API response times, and mobile app endpoints. Nothing runs dark.
02
Real-time alerting to Slack
The moment anything crosses a threshold, the engineering team is notified via Slack. No waiting for a dashboard — alerts come to where the team already works.
03
No single point of failure
Multiple independent monitoring systems (Grafana, Kibana, Firebase, AWS CloudWatch) ensure that monitoring itself cannot go blind. If one tool misses something, another catches it.
Want to know more about our infrastructure?
We are happy to walk you through our reliability practices and SLAs.
Get in touch