TransOps
Chartr's TransOps dashboard combines GTFS, AVLS and depot data into a single operational view — live fleet status, ridership analytics, efficiency metrics and compliance reporting across every route, depot and city.
0+
KPI dashboard views
0
Cities live
0+
Buses monitored
0
Efficiency dimensions
01
Dashboard Hierarchy
Drill from city-wide summaries down to individual routes and depots.
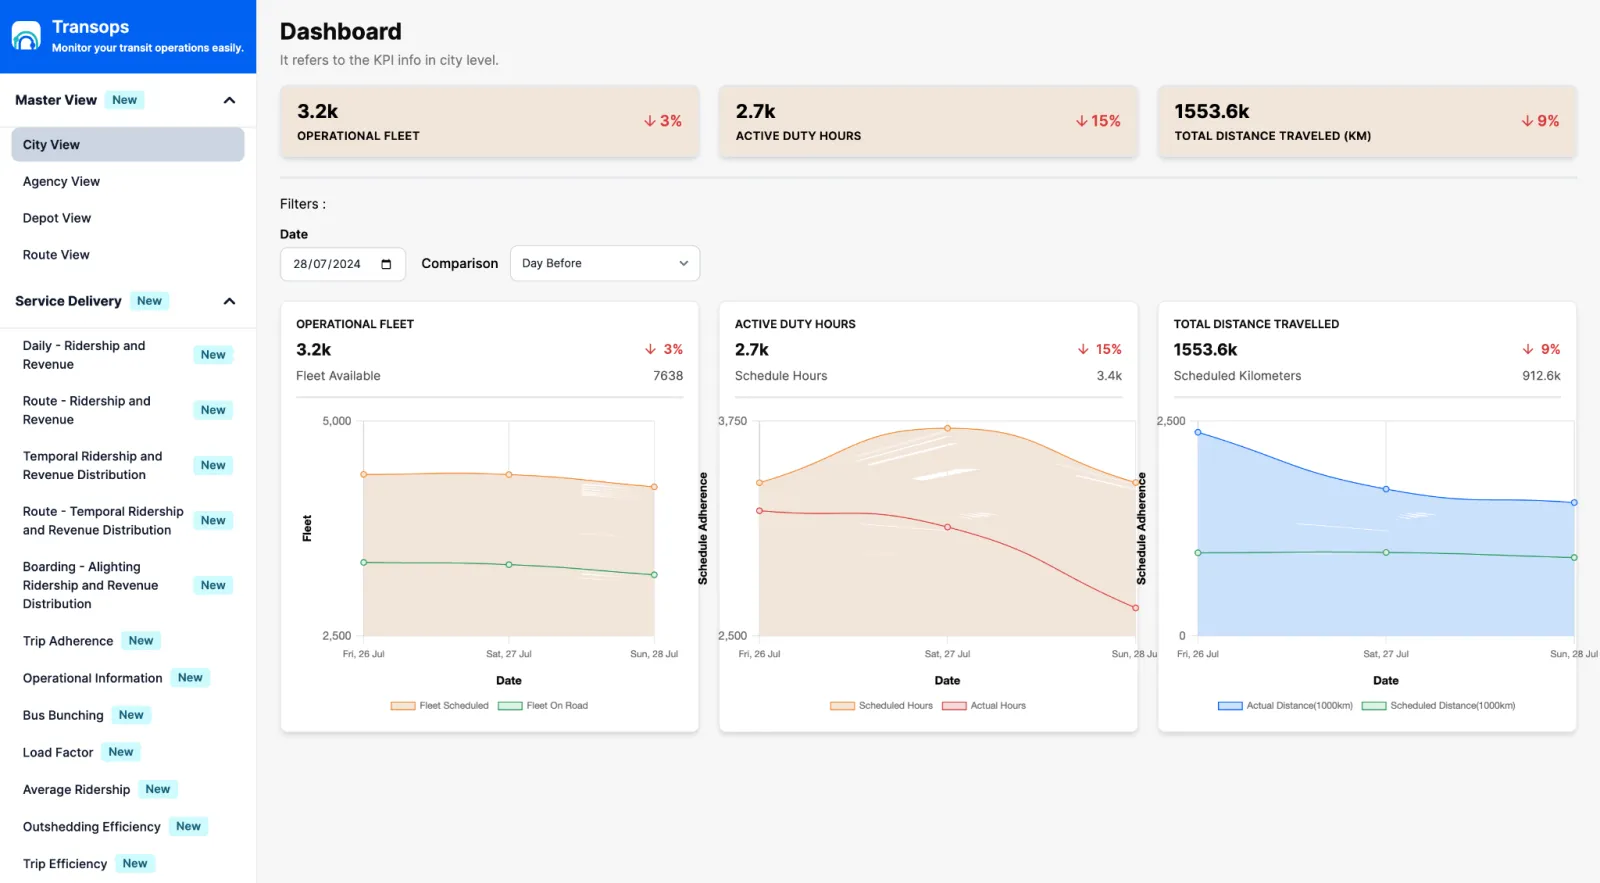
City Dashboard
Fleet count, active duty hours, total distance — at a glance
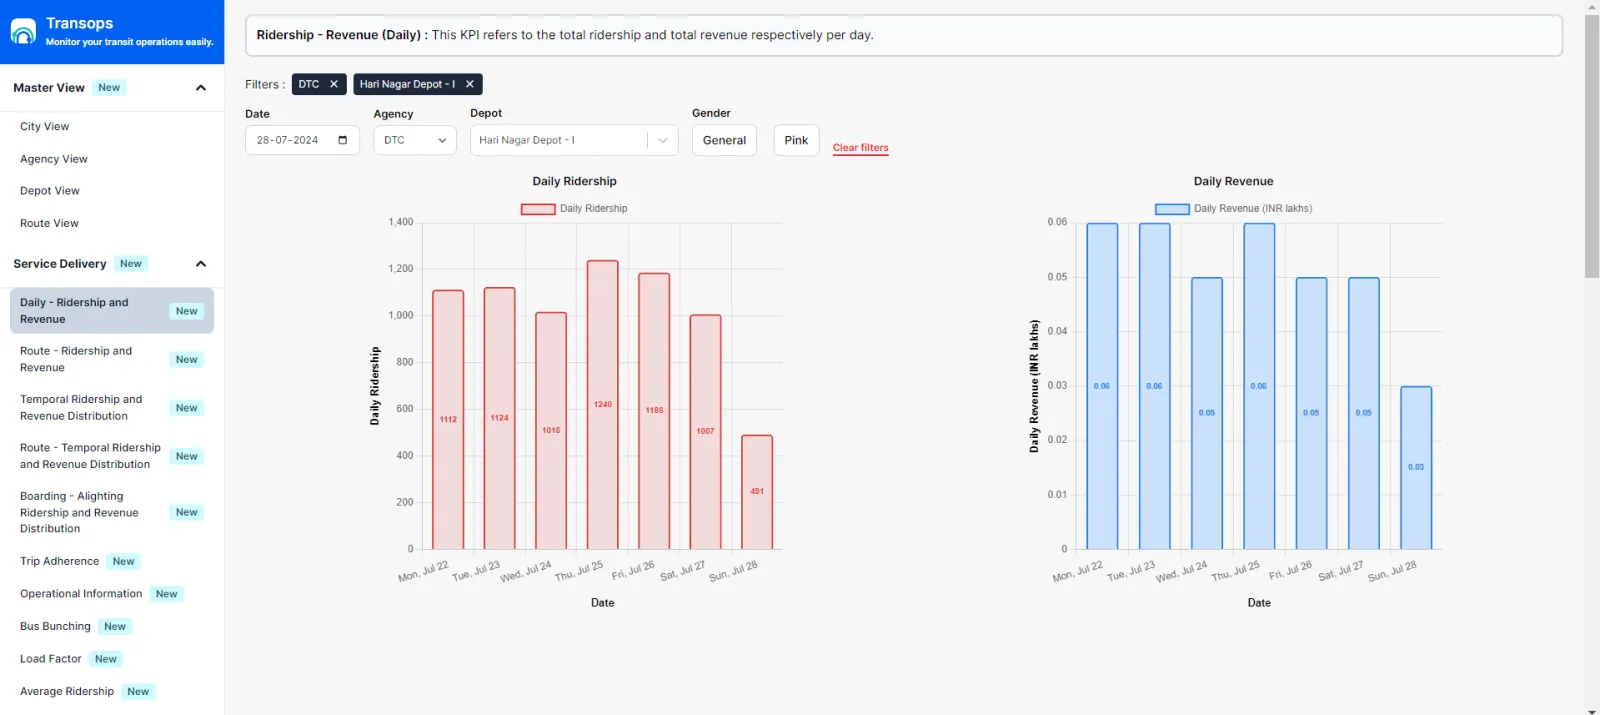
Daily Ridership & Revenue
Network-wide patronage and revenue trends
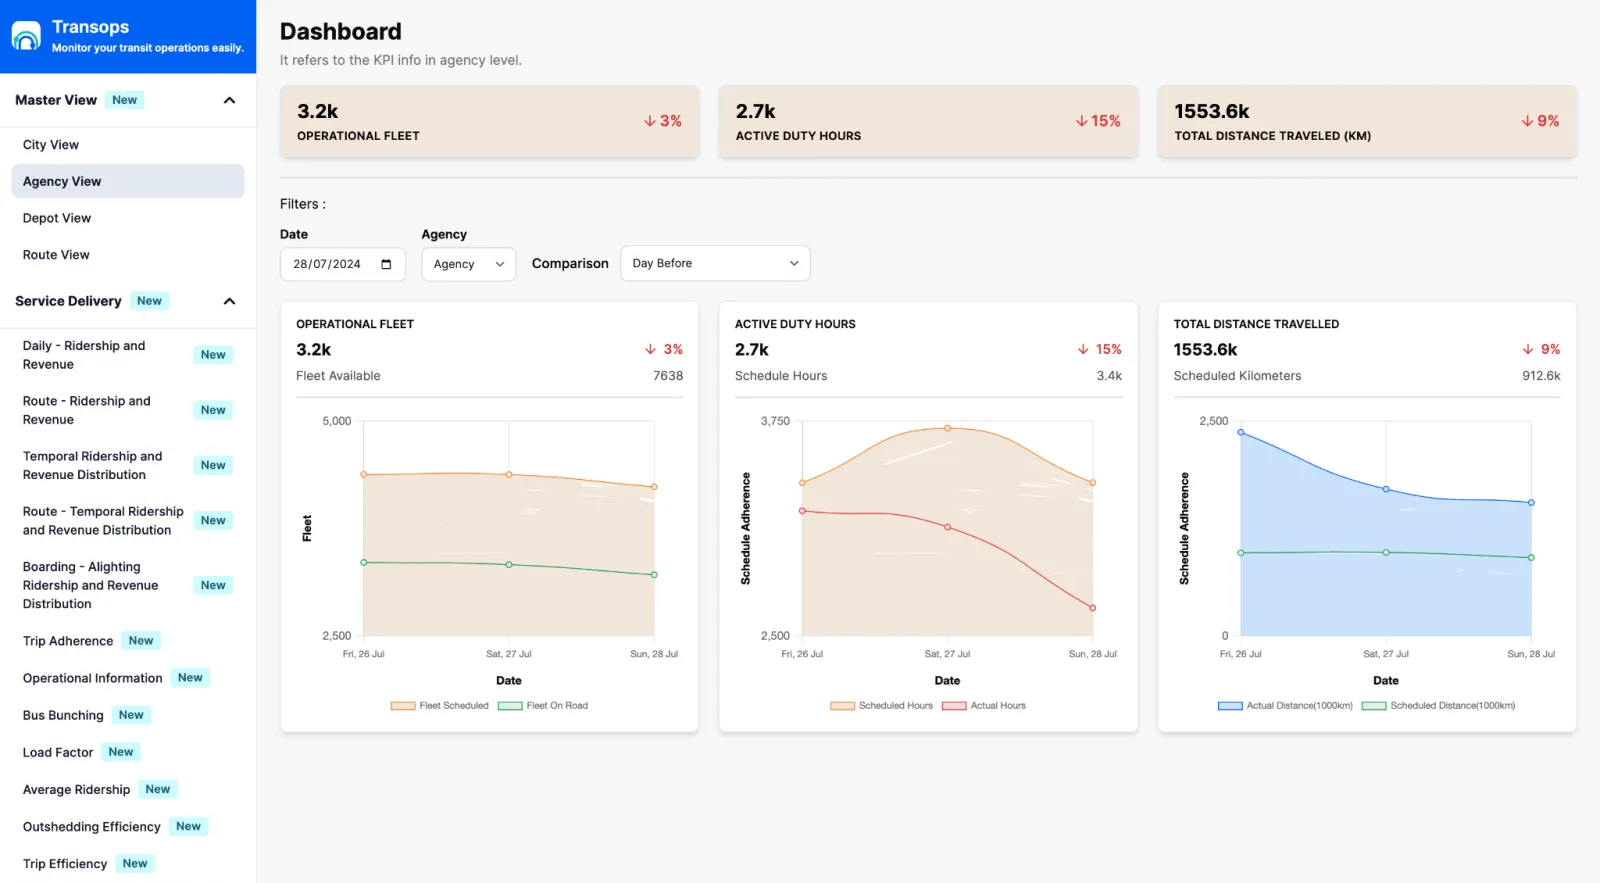
Agency Dashboard
Per-operator fleet and service breakdown
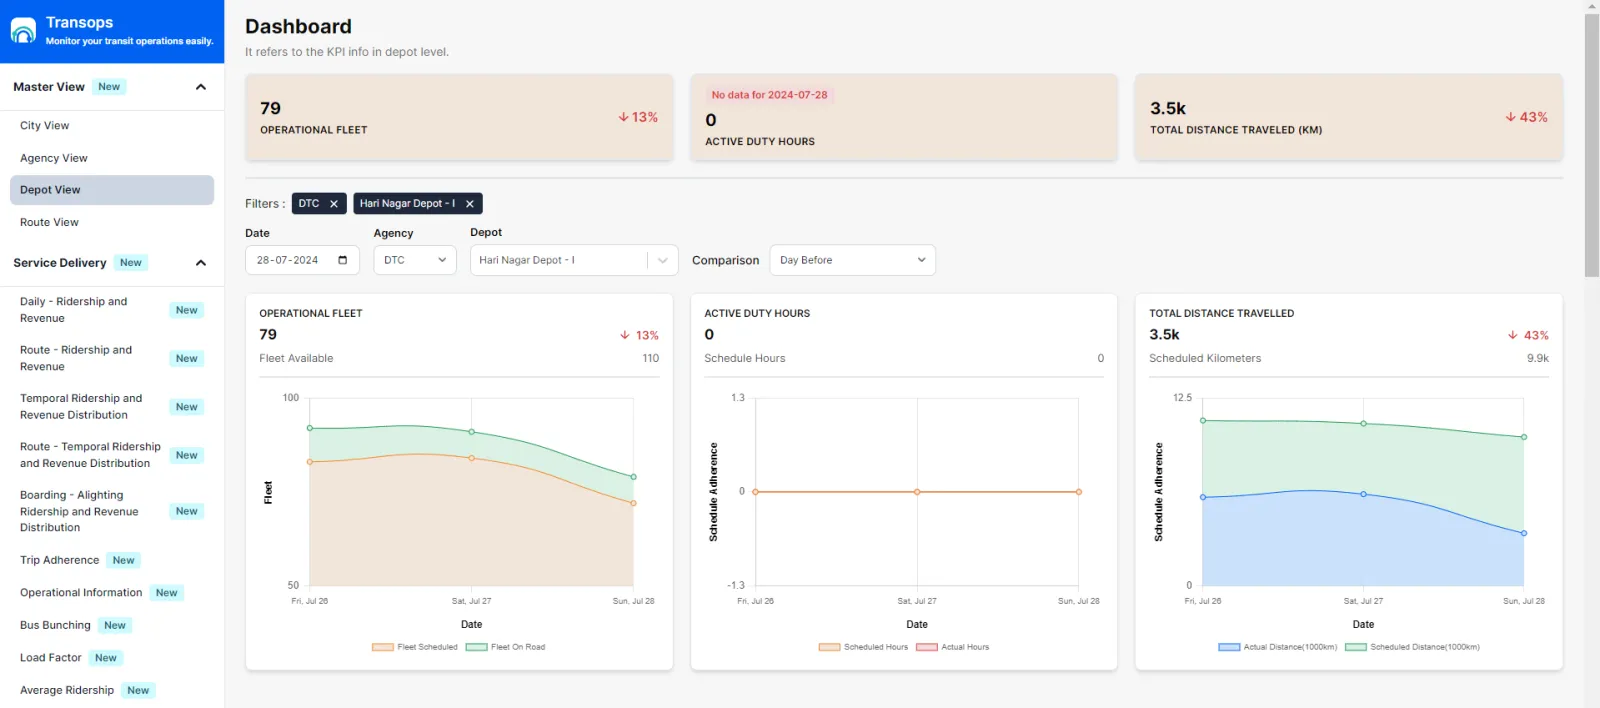
Depot Dashboard
Per-depot operations and performance
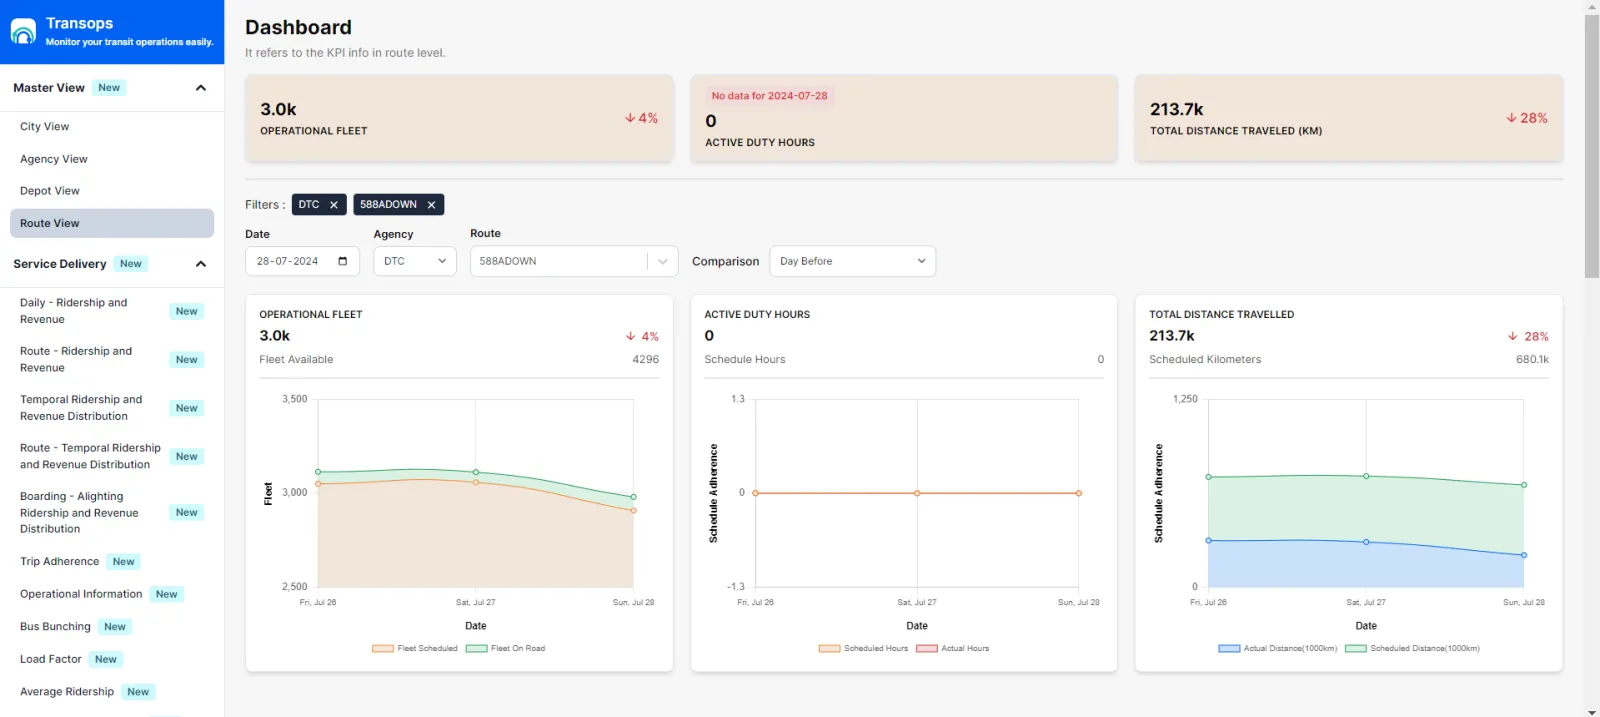
Route Dashboard
Per-route analytics and compliance
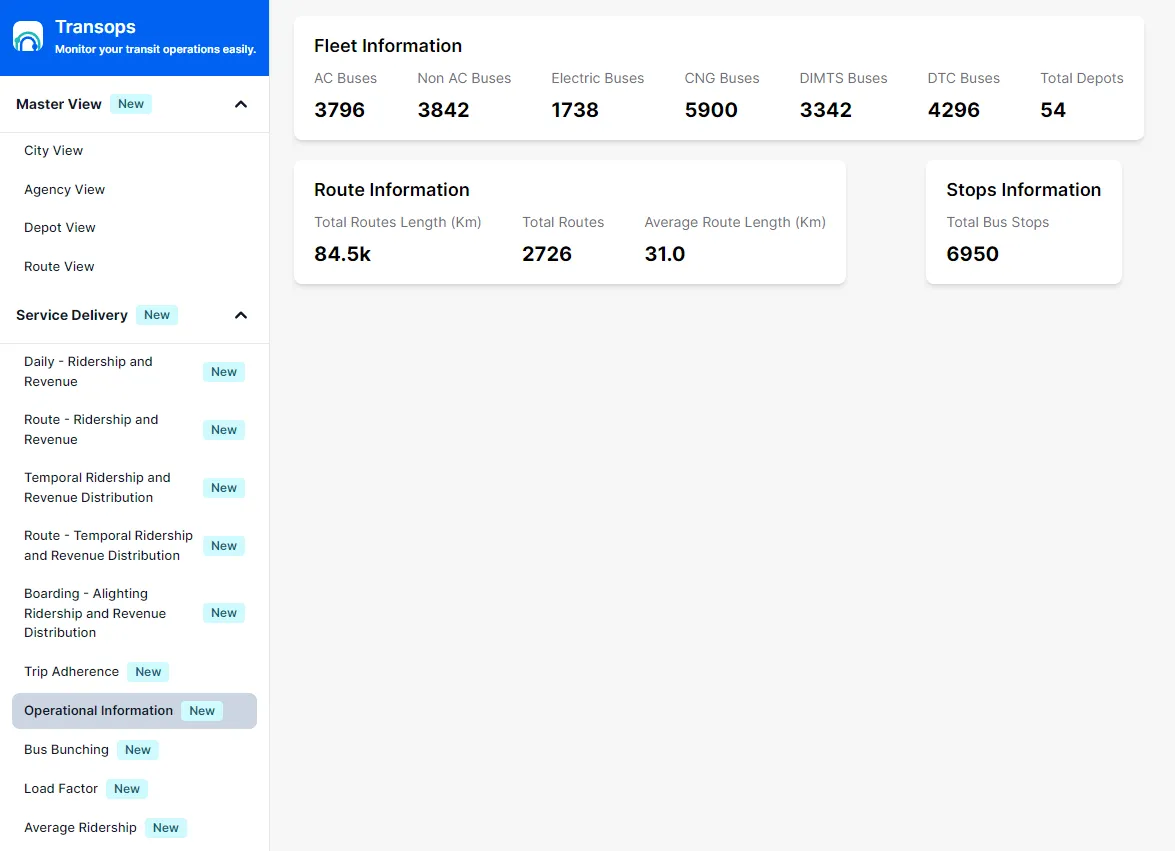
Master View
Fleet, routes, stops in one view
02
Operations & Safety
Track adherence, detect bunching, and flag safety incidents in real time.
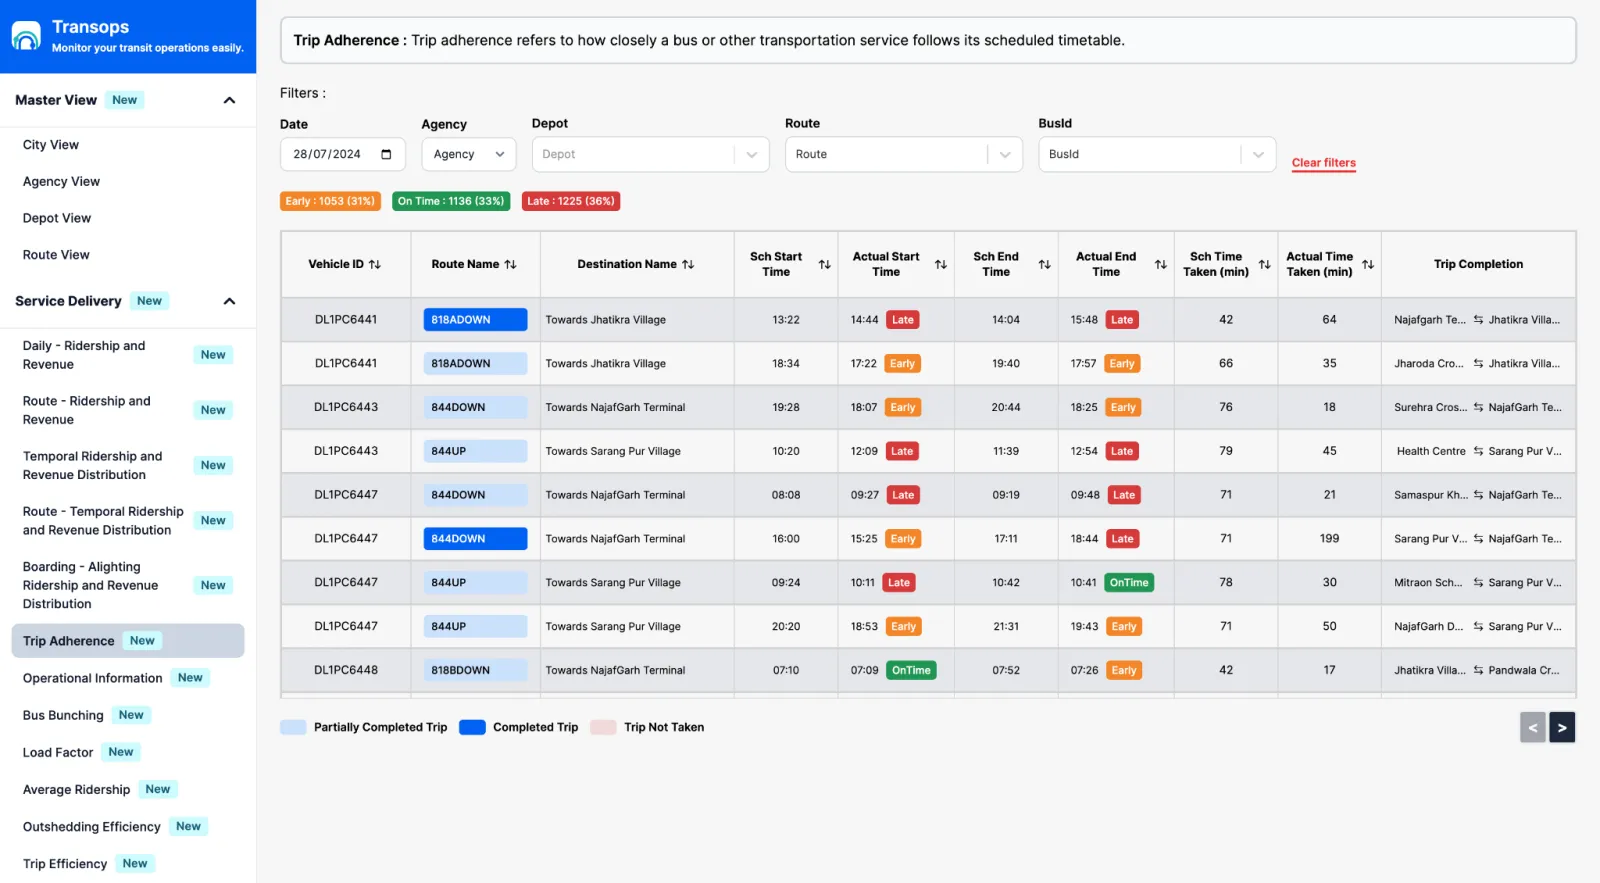
Trip Adherence
Early, On-Time, Late breakdown per route and shift
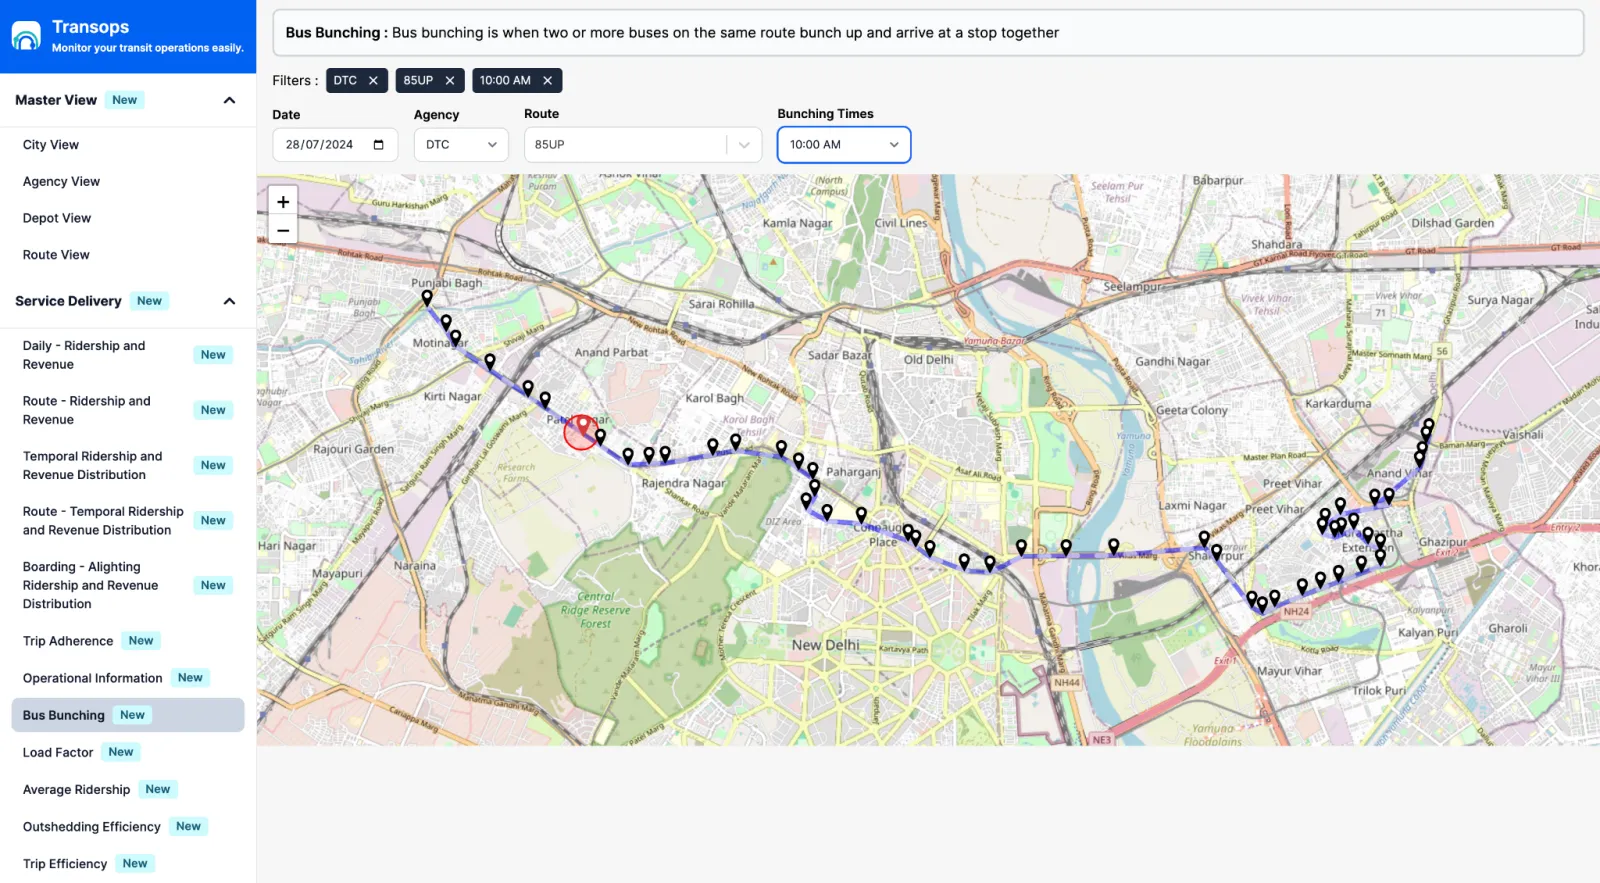
Bus Bunching Detection
Live map highlighting cluster runs on any route
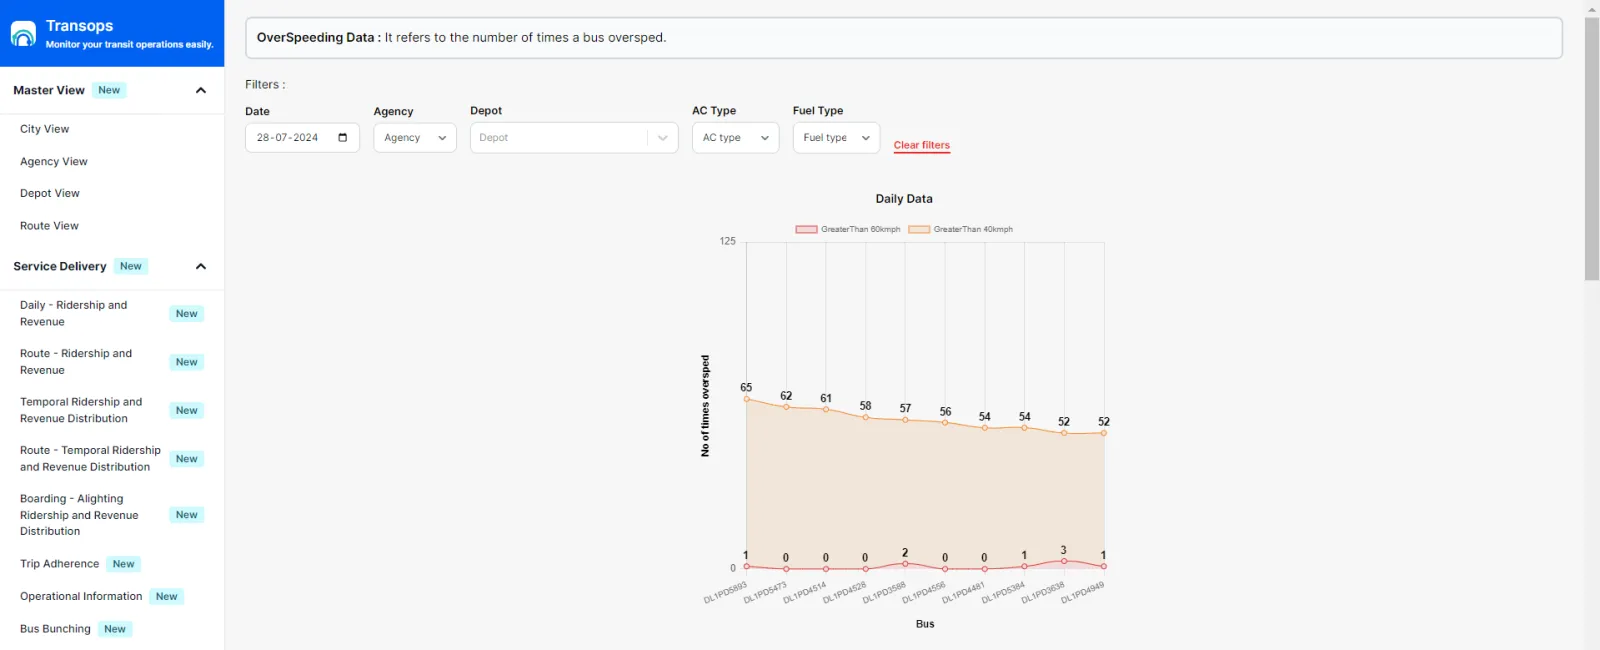
Safety Monitoring
Overspeeding incidents per bus with timestamps
03
Temporal & Route Analytics
Understand when and where passengers travel across your network.
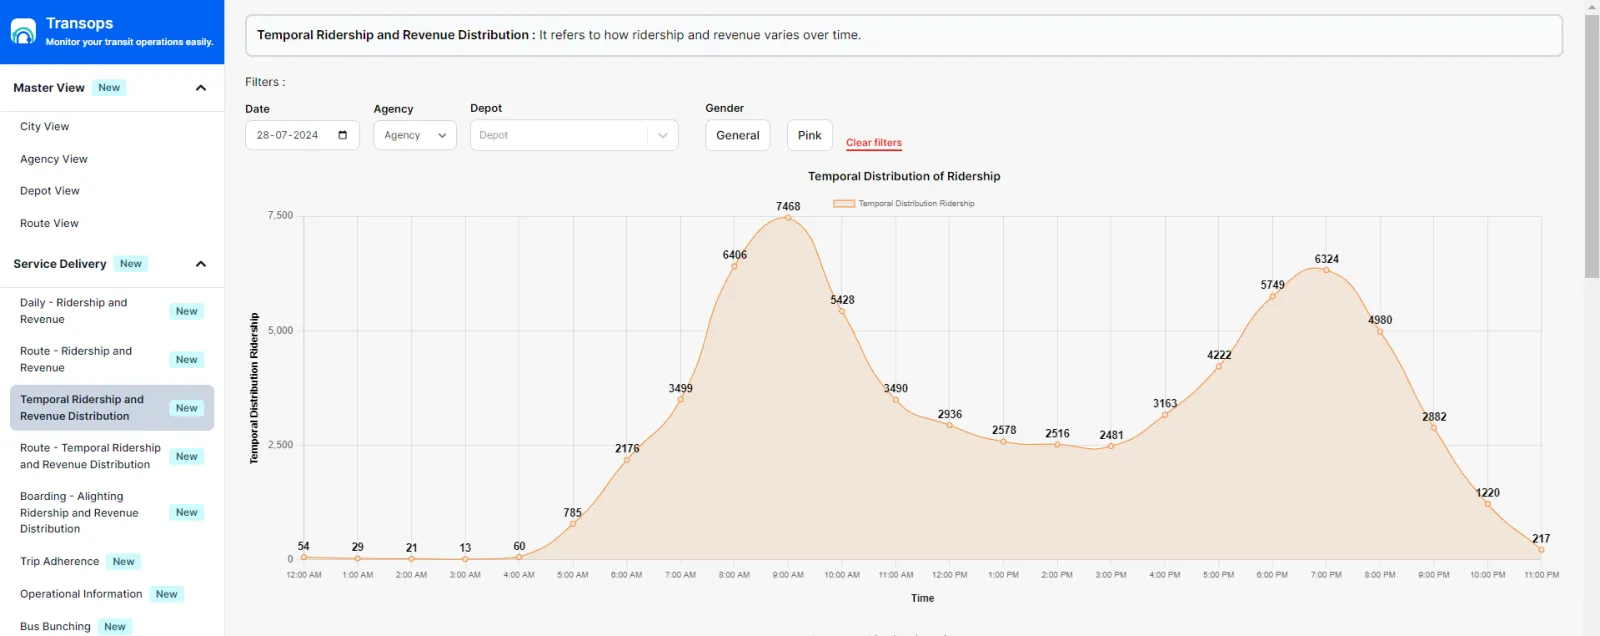
24-Hour Demand Curve
Visualise AM/PM peaks and off-peak service gaps
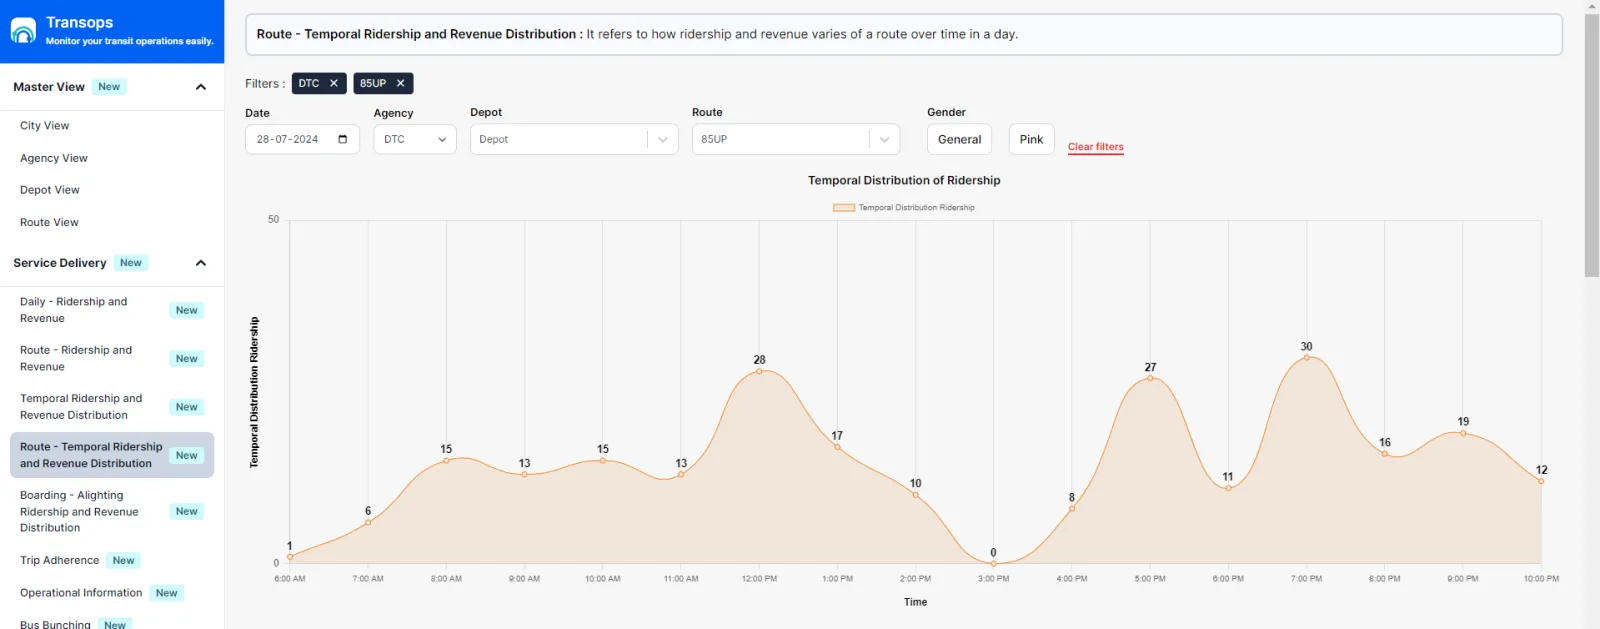
Route Temporal Distribution
Hourly ridership pattern per individual route
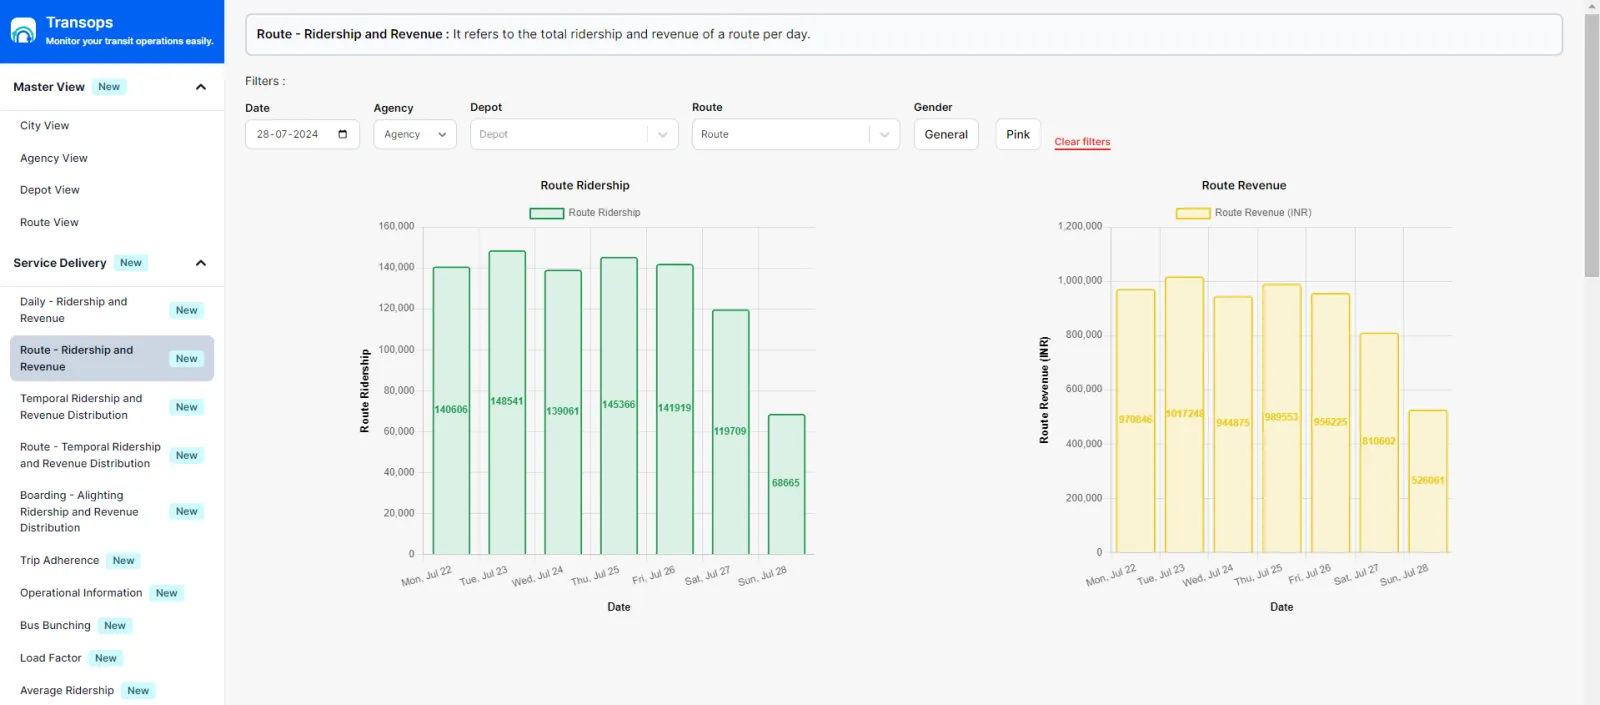
Route Ridership & Revenue
Revenue and ridership broken down by route
04
Ridership Insights
Load metrics for smarter scheduling decisions.
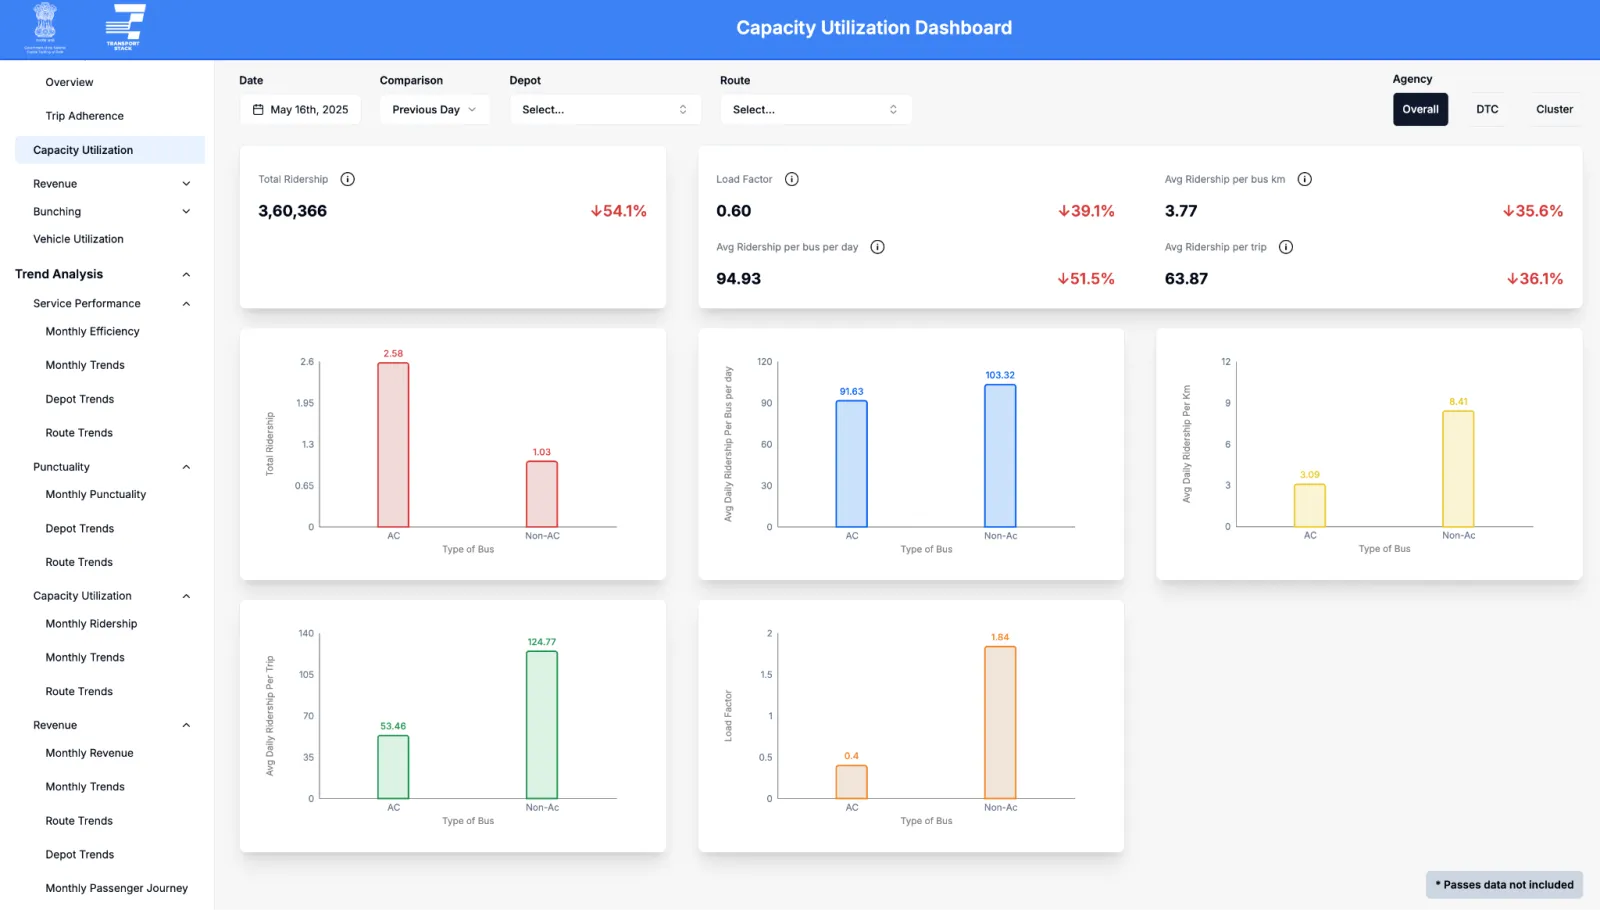
Capacity Utilisation
Network-wide load factor vs. available capacity
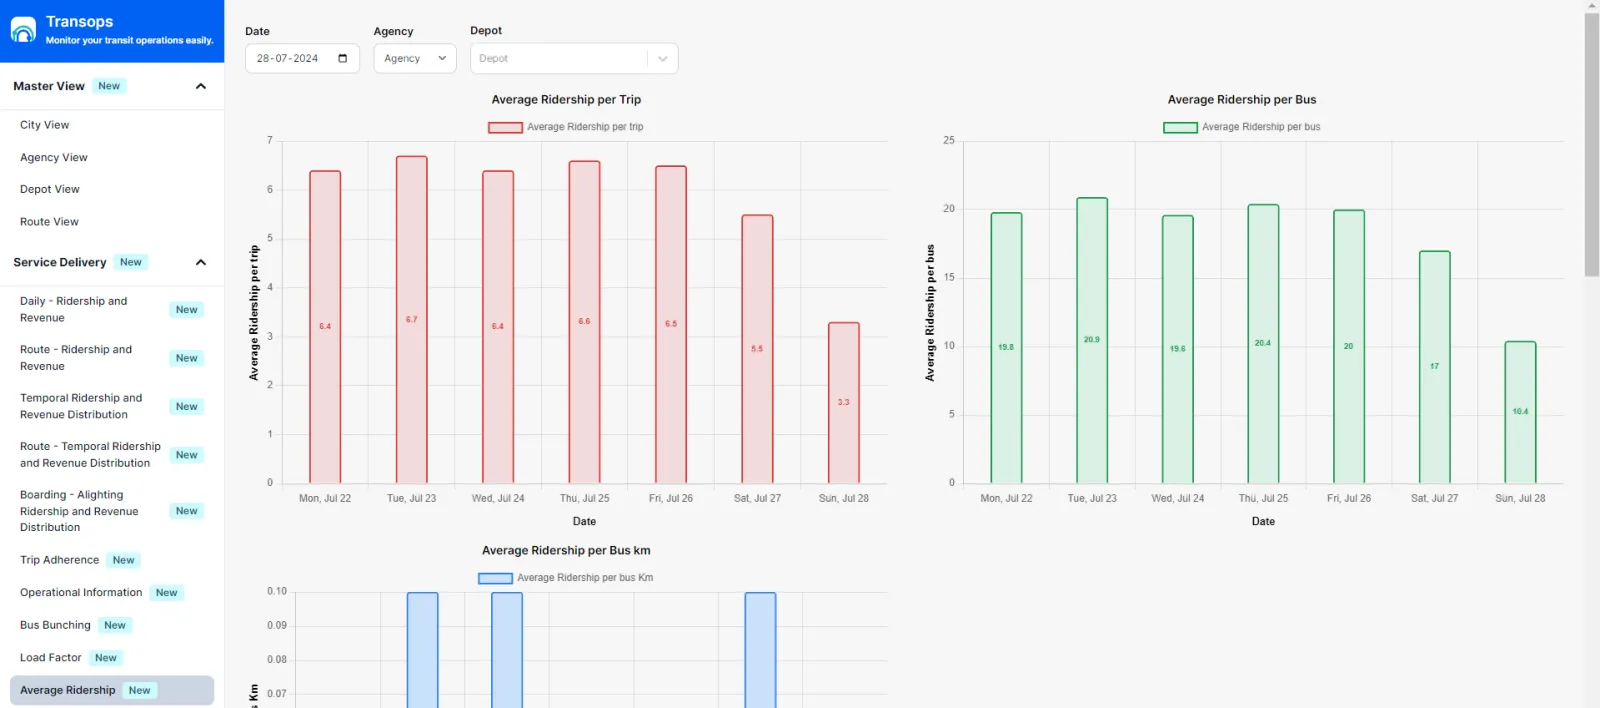
Avg Ridership per Trip & Bus
Evaluate average load across trips and buses
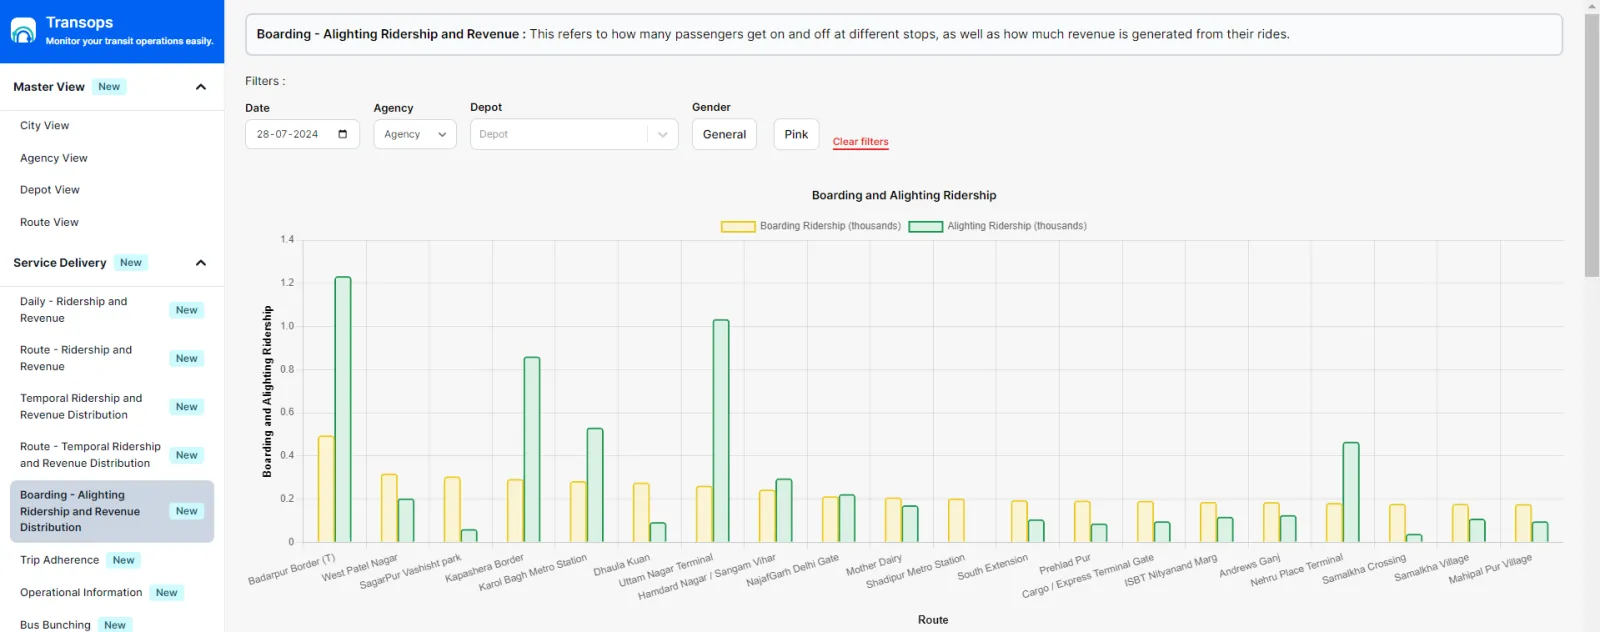
Boarding & Alighting by Stop
Identify high-demand stops for capacity planning
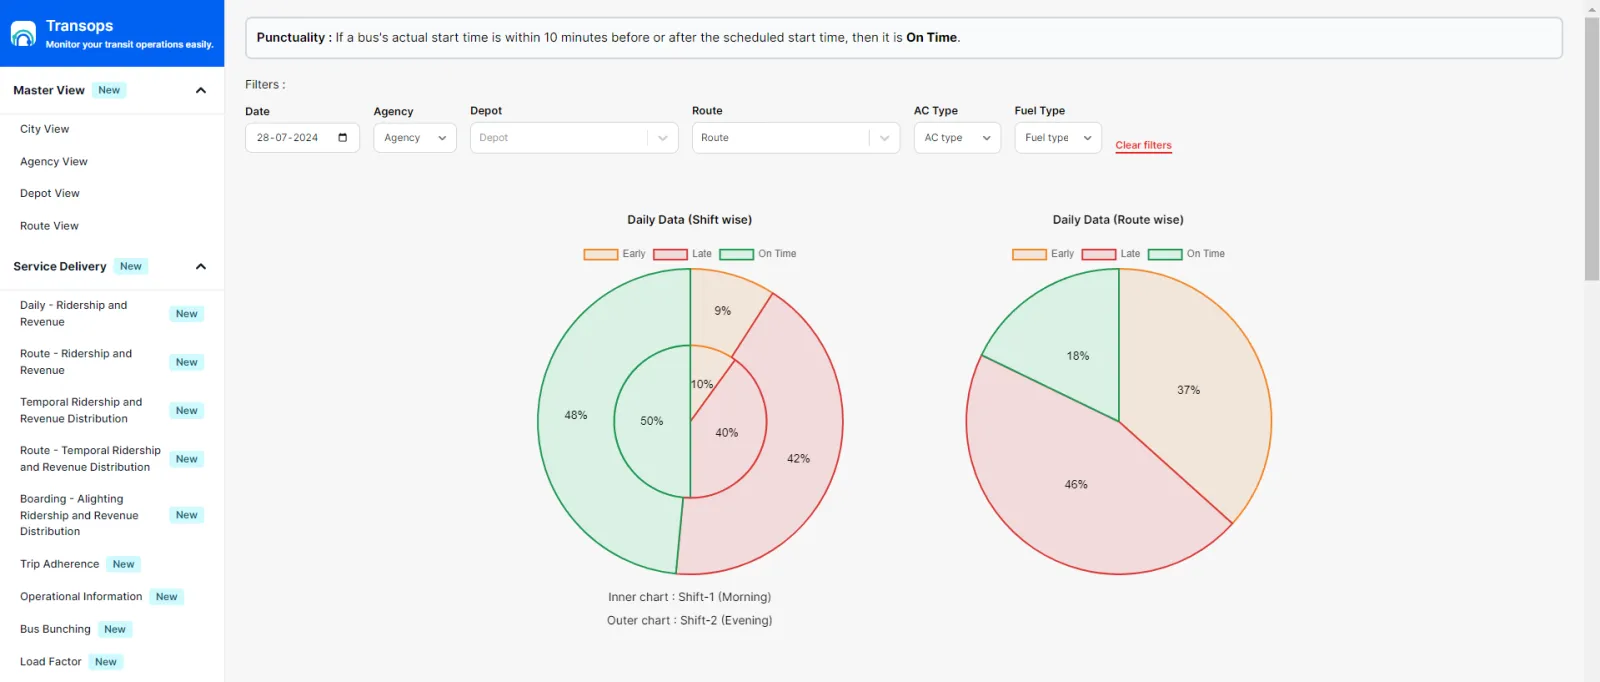
Punctuality Analysis
On-time performance by shift and route
05
5 Efficiency Dimensions
Track how well every hour, kilometre, trip, duty and outshedding event converts into productive service.
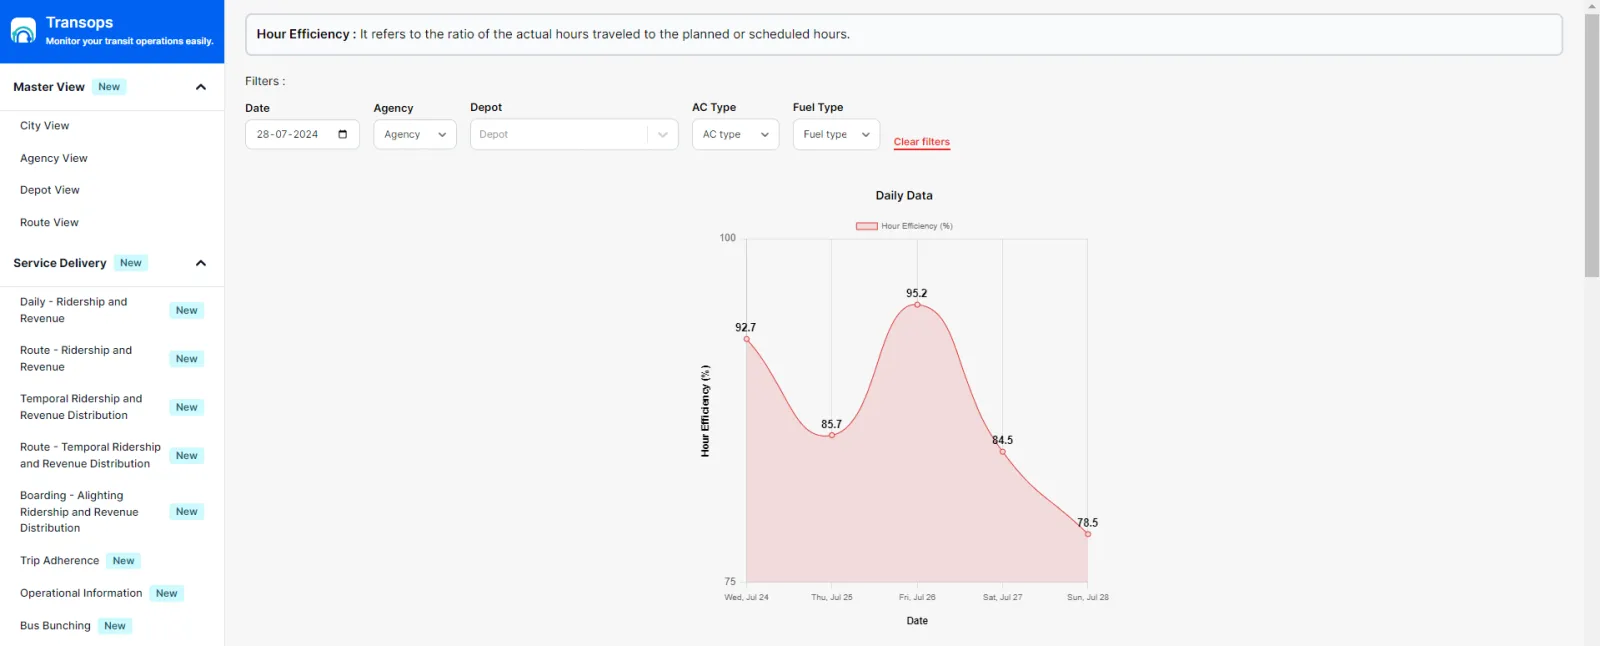
Hour Efficiency
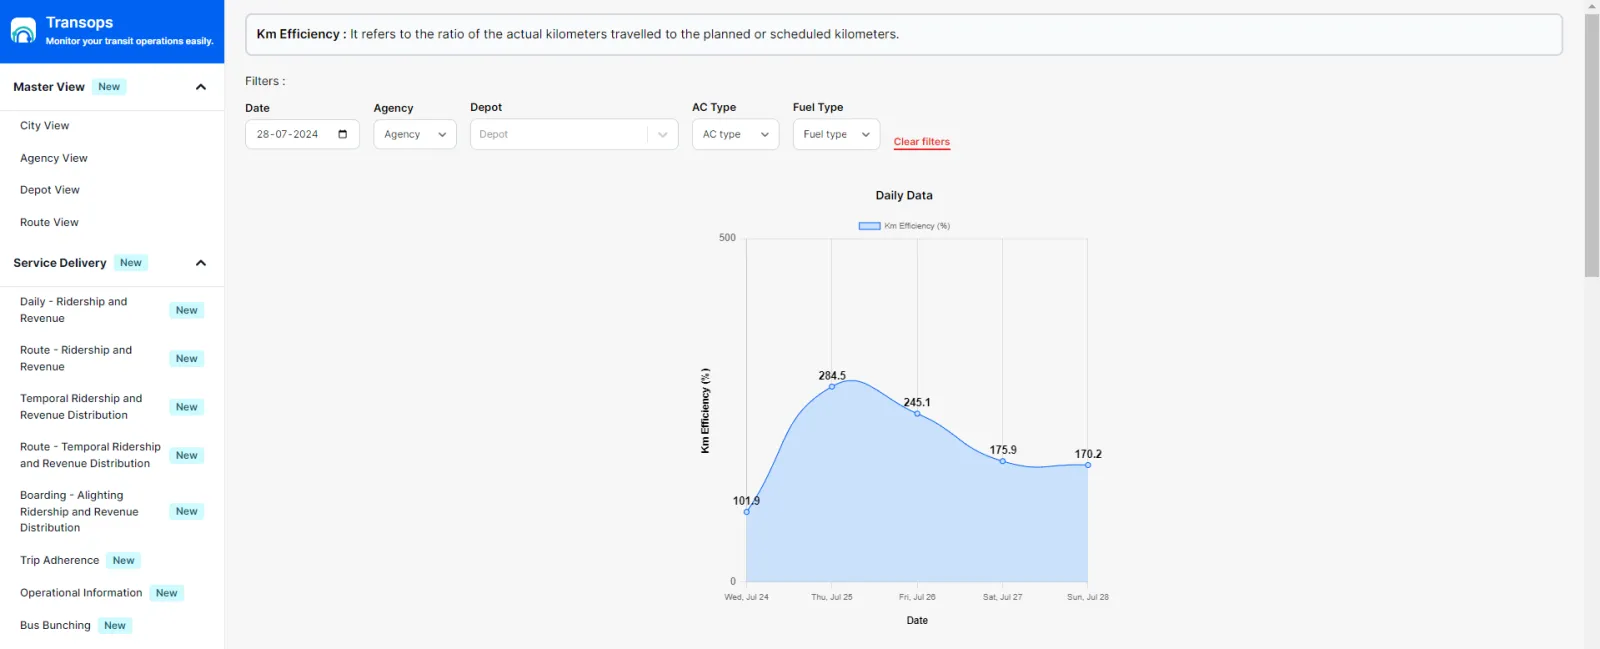
Km Efficiency
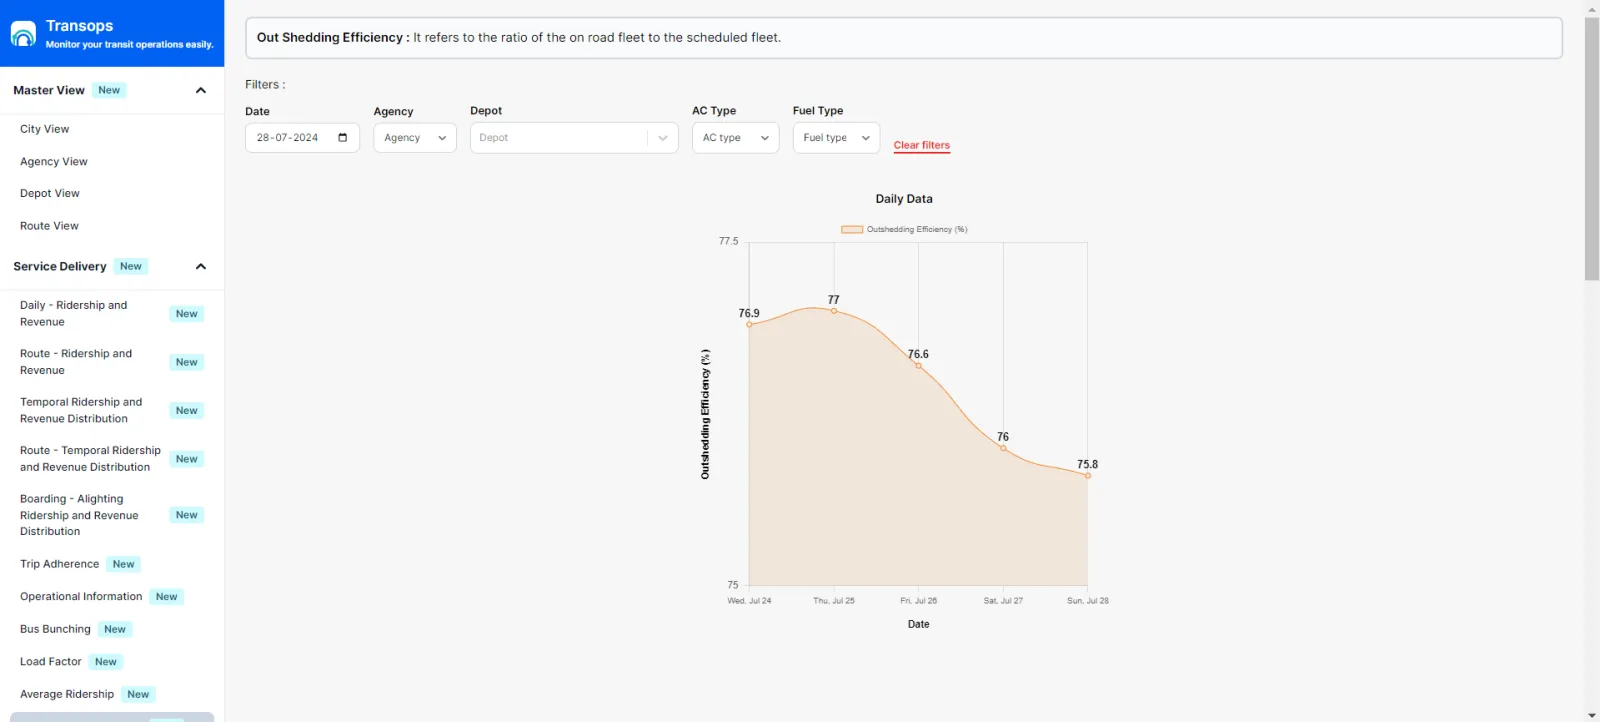
Outshedding Efficiency
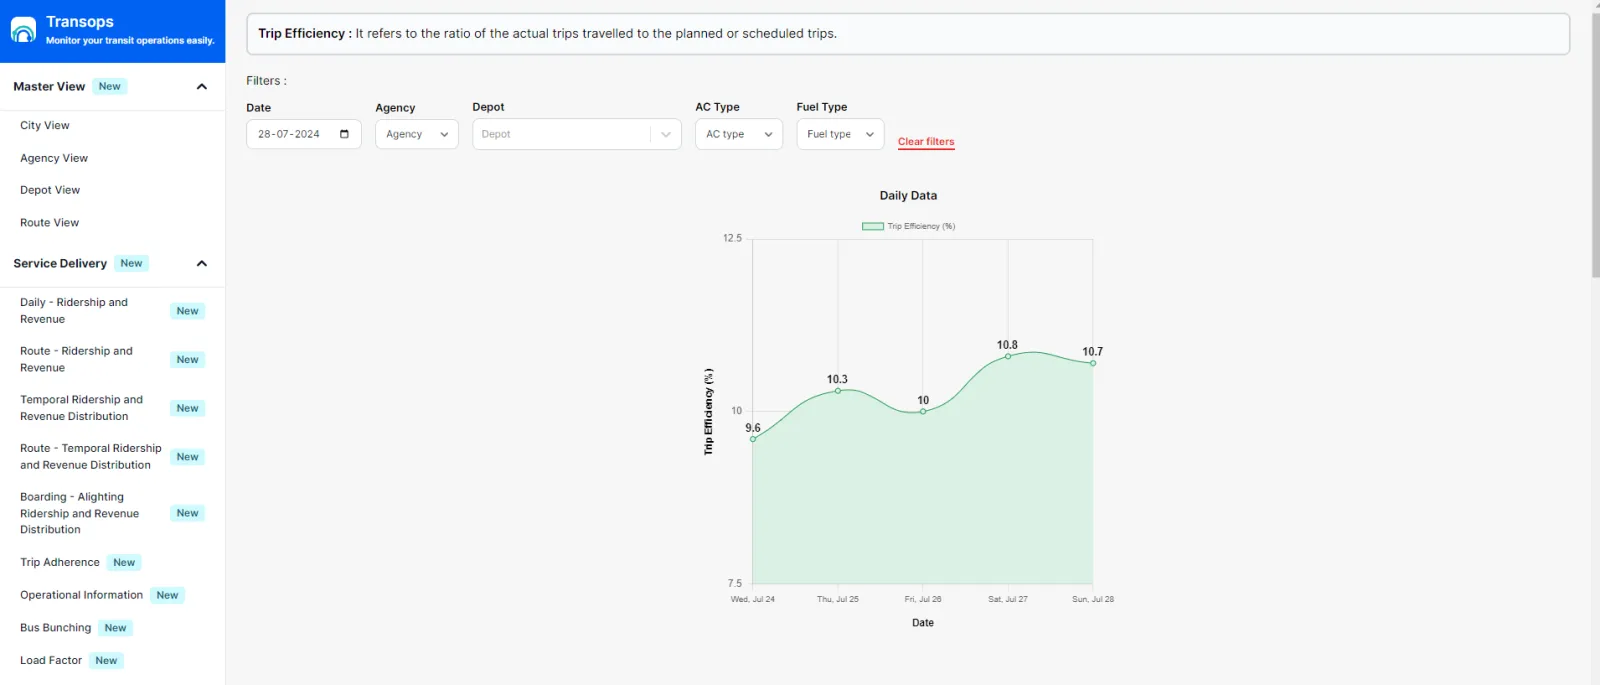
Trip Efficiency
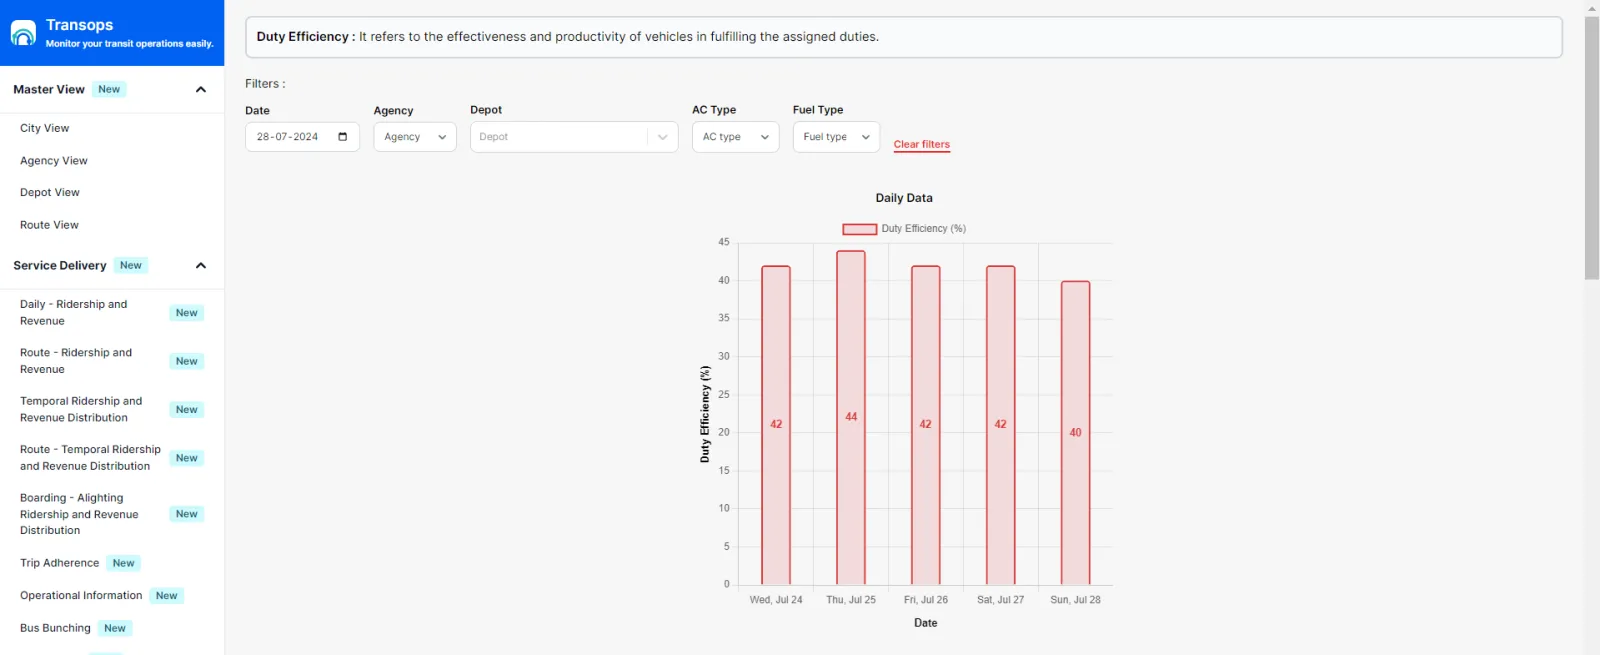
Duty Efficiency
06
Fleet Performance Metrics
Deep metrics on fleet utilisation and service delivery quality.
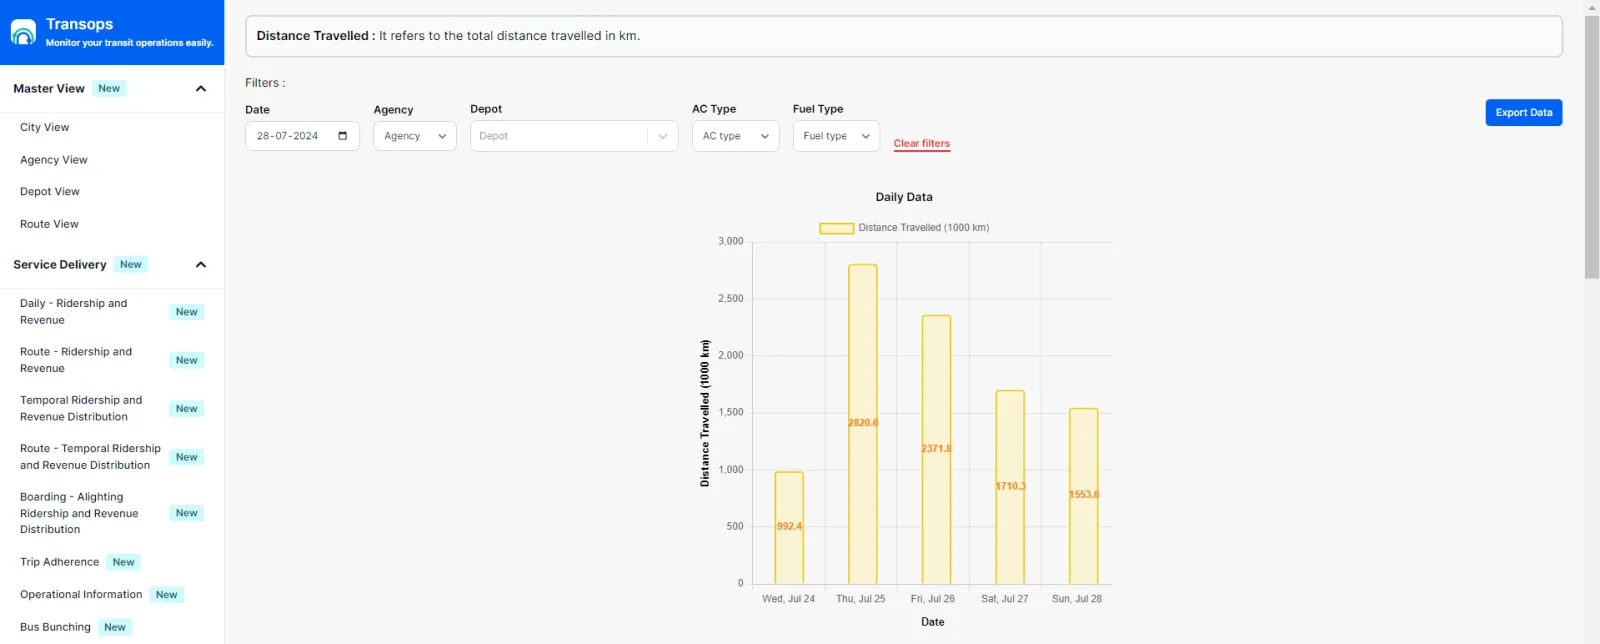
Distance Travelled
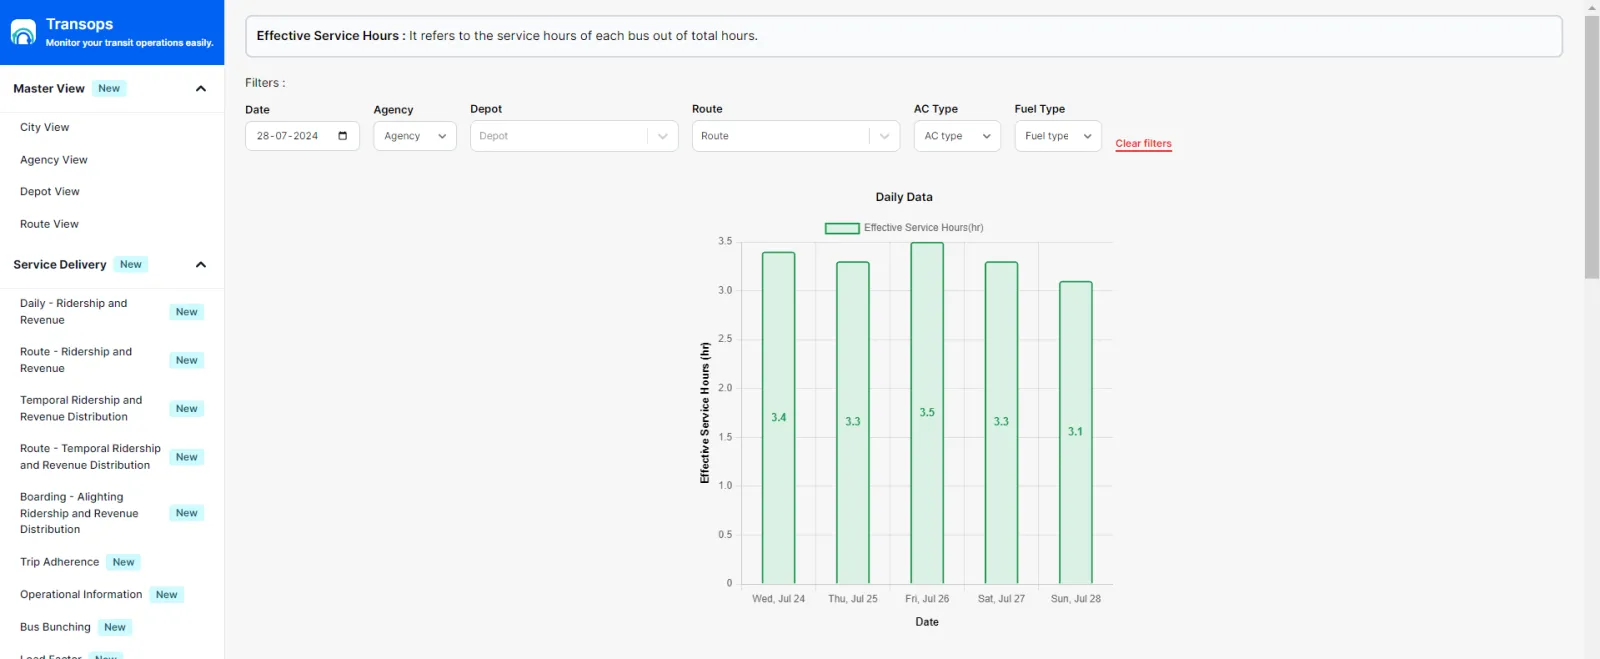
Effective Service Hours
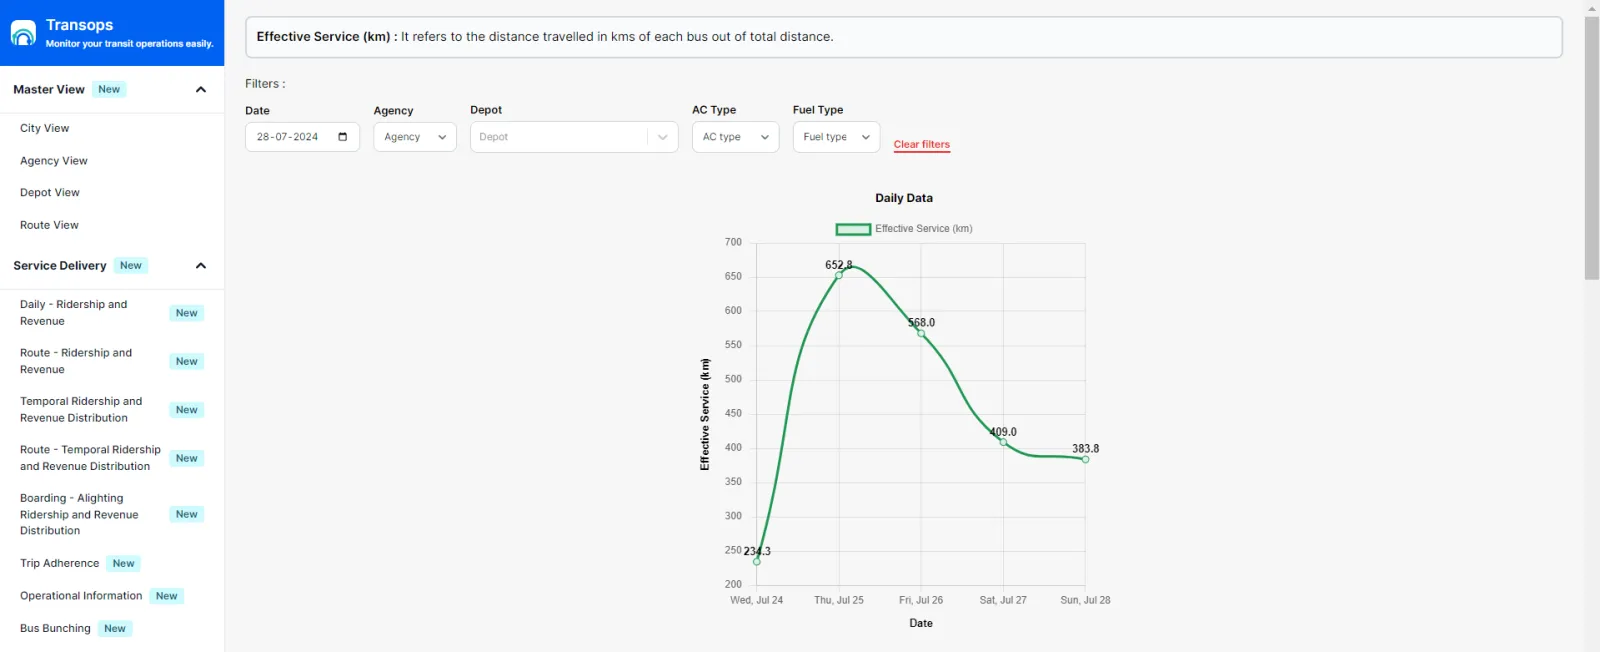
Effective Service Km
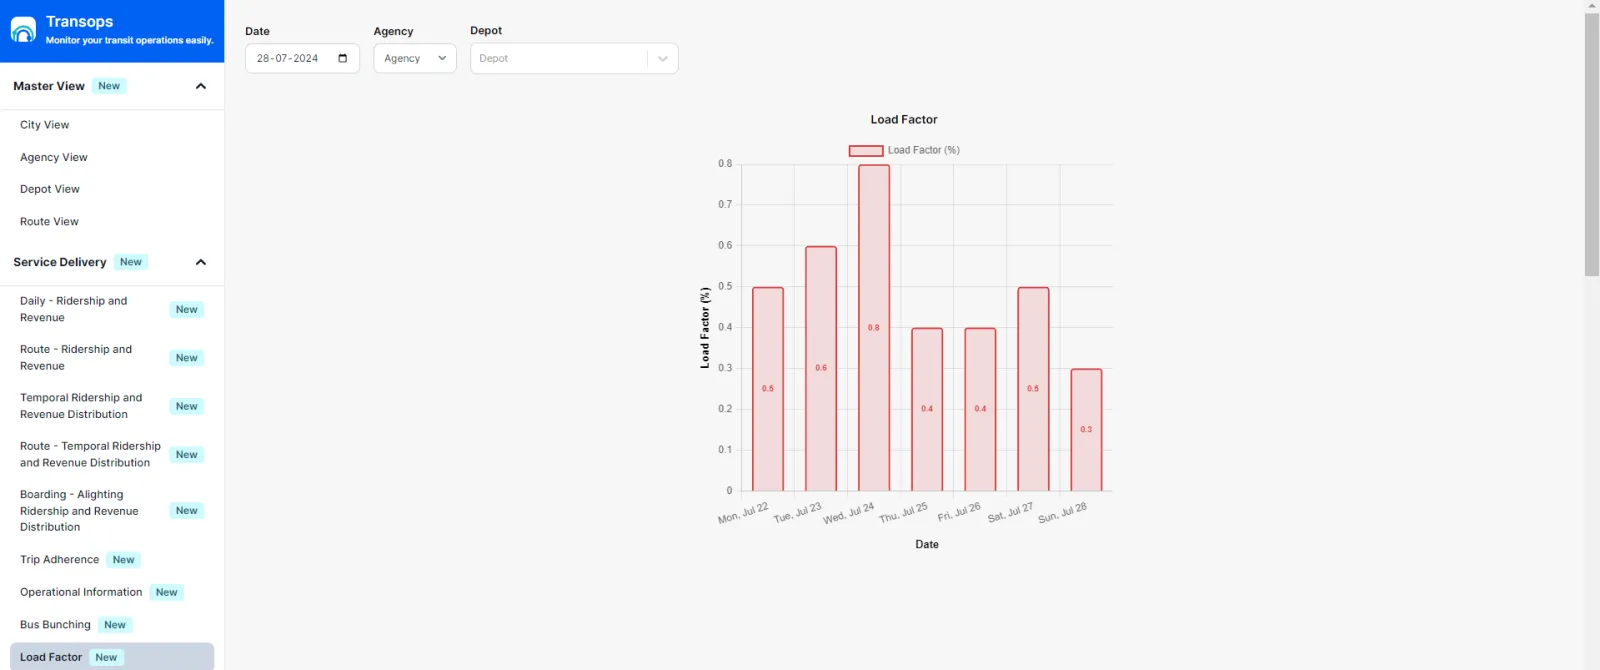
Load Factor
Ready to see TransOps on your network?
Tell us about your fleet and we'll show you what the dashboard looks like with your data.
Get in touch